Longacres Finance
Is Realty Income (NYSE: O) a Buy at a 6% Yield? (Fair Value & Dividend Safety Analysis)
Is Realty Income (NYSE: O) a buy at a 6.11% yield? We analyze its 32-year dividend growth streak, fundamental stability, and fair value metrics using the Yieldr Stock Analyzer to determine if this monthly income REIT is currently trading at an attractive 8% discount.
For income-focused investors, Realty Income Corporation (NYSE: O) famously known as "The Monthly Dividend Company" is often considered a foundational portfolio holding. However, with persistent macroeconomic shifts and rising bond yields pressuring real estate investment trusts (REITs), many investors are asking: Is Realty Income stock currently undervalued, or is the 6%+ yield a sign of trouble?
In this breakdown, we examine Realty Income’s fundamental metrics, dividend sustainability, and valuation using key data points from the Yieldr Stock Analyzer.
Realty Income at a Glance
Realty Income is an S&P 500 REIT with a 52-year operational history and over 32 consecutive years of dividend growth, making it a proud member of the S&P 500 Dividend Aristocrats index.
- Ticker: NYSE: O
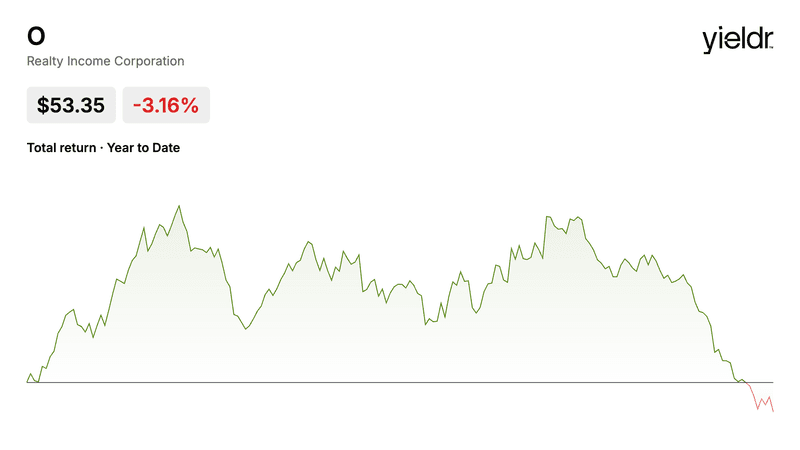
- Current Stock Price: $53.35
- 52-Week Range: $53.33 – $67.94
- Market Cap: $49.7B
- Forward Dividend Yield: 6.11%
- Payout Frequency: Monthly
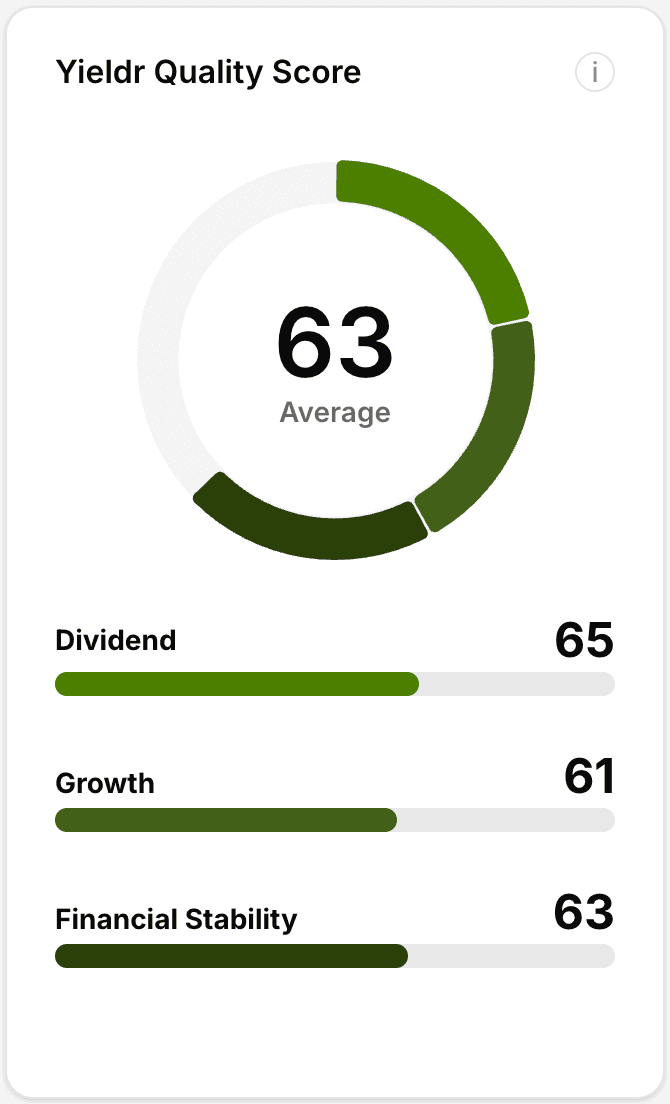
Yieldr Quality Score Breakdown
Yieldr rates stocks across three core pillars: Dividend, Growth, and Financial Stability. Currently, Realty Income earns an overall Yieldr Quality Score of 63 (Average).
Yieldr Valuation Breakdown: 3 Distinct Fair Value Models
To give dividend investors a complete, multi-perspective picture of valuation, Yieldr evaluates Realty Income (NYSE: O) across three core valuation models: Price-to-Earnings (P/E), Free Cash Flow (FCF), and Dividend Yield Theory (DYT).
Combining these three methodologies produces an Average Fair Value of $58.00, indicating Realty Income is trading at roughly an 8% Discount relative to its current share price of $53.00.
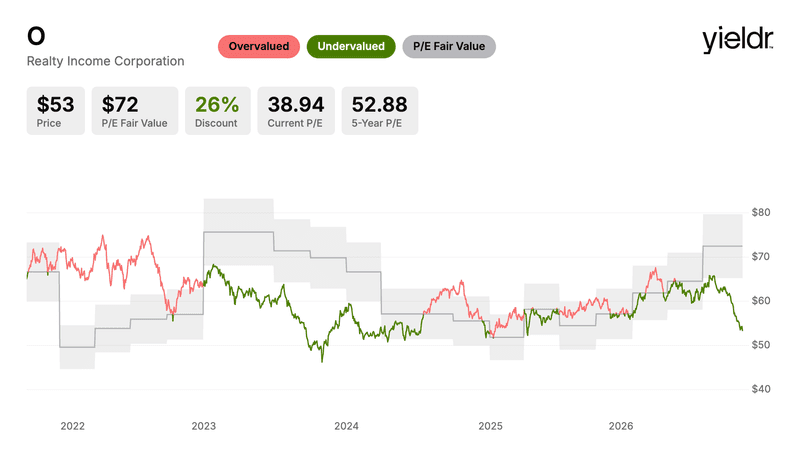
1. P/E Fair Value: $72 (26% Discount)
- Current P/E: 38.94
- 5-Year Historical P/E: 52.88
- Takeaway: Based strictly on historical earnings multiples, Realty Income looks heavily discounted relative to its 5-year average valuation.
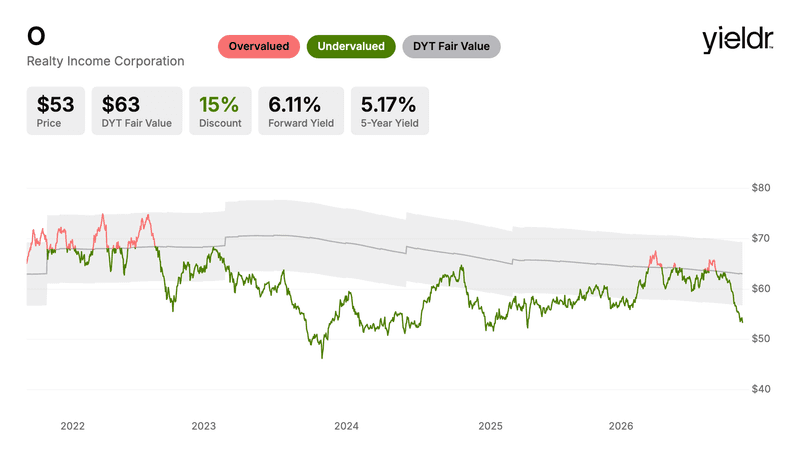
2. Dividend Yield Theory (DYT) Fair Value: $63 (16% Discount)
- Forward Yield: 6.11%
- Historical Average Yield: ~5.1% – 5.3%
- Takeaway: Dividend Yield Theory assumes that a stable dividend grower’s yield will revert to its long-term average over time. With the yield hovering near 6.11%, the DYT model suggests significant upside toward $63 if the yield normalizes.
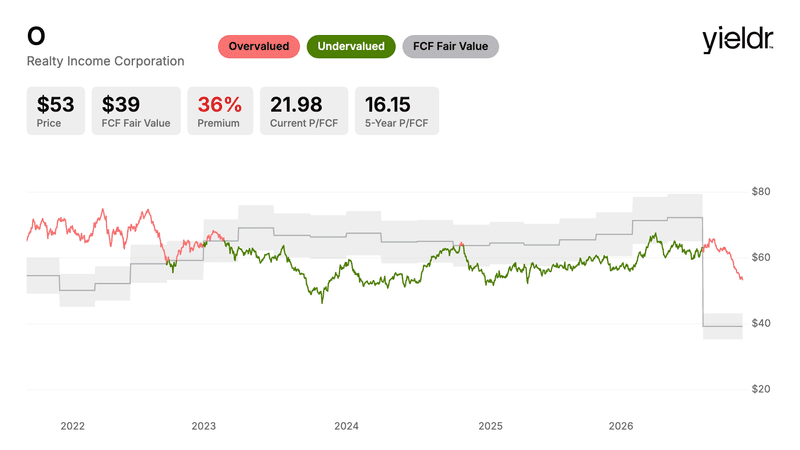
3. FCF Fair Value: $39 (Overvalued Signal)
- Current P/FCF: 21.98
- 2026 FCF Per Share: $2.43
- Takeaway: The Free Cash Flow model paints a more conservative picture ($39 Fair Value). Because REITs carry high debt service and property acquisition costs, GAAP FCF can fluctuate year-over-year (dropping -45% in 2026 to $2.43/share), which lowers the standalone FCF valuation.
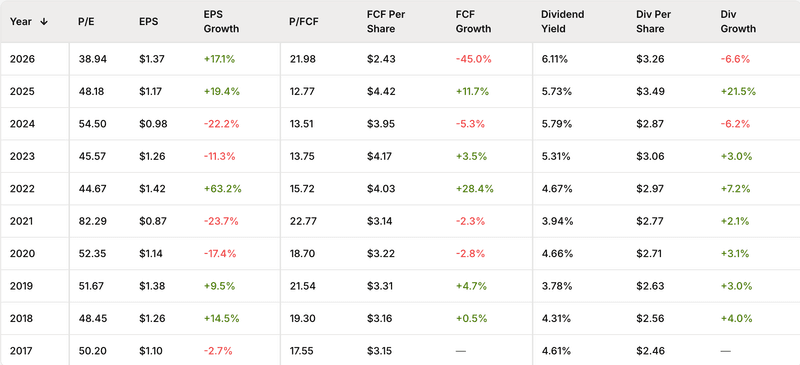
Historical Multiples & Per-Share Performance (2017 – 2026)
Tracking Realty Income’s historical trends on Yieldr highlights how valuation multiples and cash flows have evolved over the last decade:
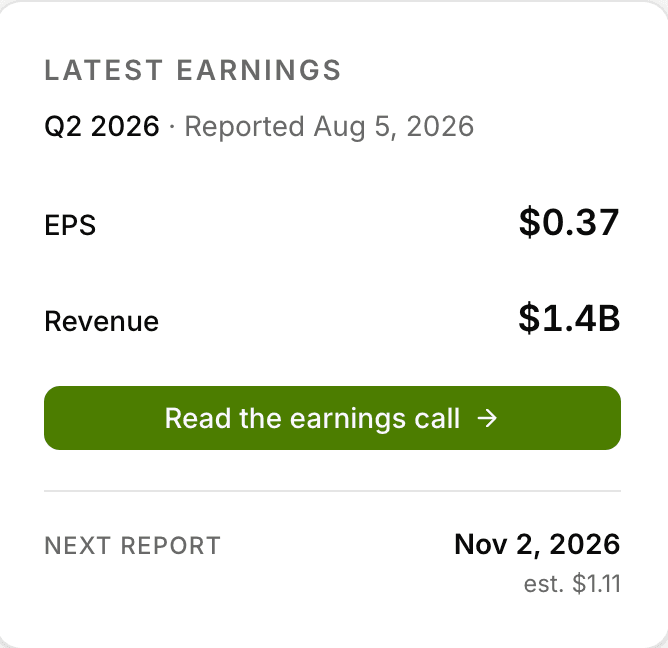
Earnings & Catalyst Watch
- Last Quarter (Q2 2026): EPS of $0.37 on Revenue of $1.4B.
- Next Earnings Release: November 2, 2026 (Estimated EPS: $1.11).
Dividend Growth & Safety Analysis
Dividend Growth Velocity
While Realty Income’s dividend payout is reliable, dividend growth has moderated into the low single digits in recent years:
- 1-Year CAGR: +2.93%
- 5-Year CAGR: +3.52%
- 10-Year CAGR: +3.87%

Payout Ratio Context
Yieldr displays a raw GAAP Payout Ratio of 229.07% (with 5-year and 10-year historical averages at 272.0% and 238.9%, respectively).
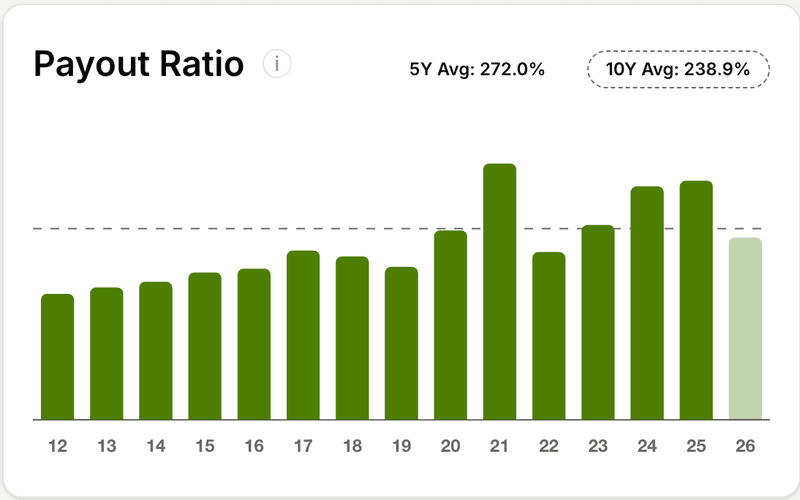
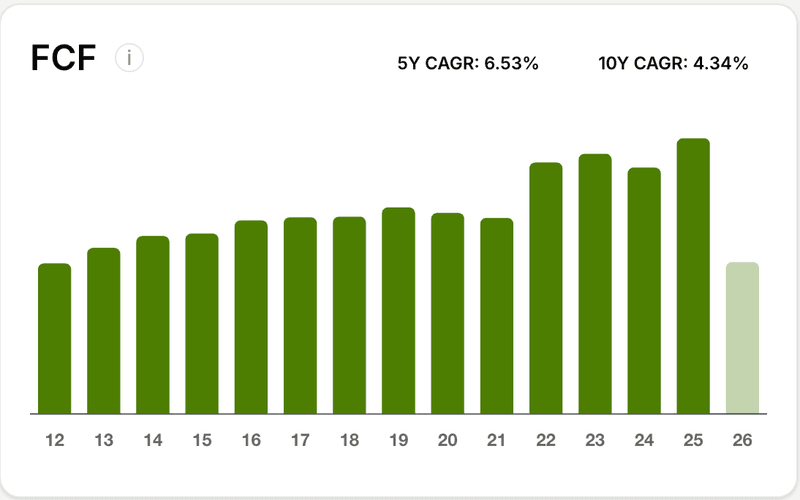
Important REIT Note: Traditional GAAP payout ratios calculate dividends against Net Income, which factors in non-cash depreciation and amortization expenses. For REITs like Realty Income, cash flow coverage via Funds From Operations (FFO) or Free Cash Flow (FCF) is the primary metric for dividend safety. With an FCF 5-year CAGR of 6.53% and steady operating cash flows, the monthly distribution remains solidly supported.
Profitability & Financial Health
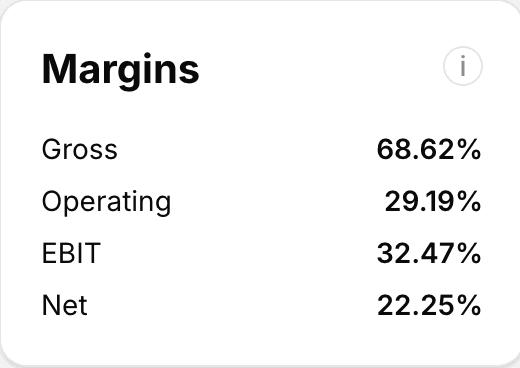
Realty Income maintains strong operational margins, though high capital intensity keeps standard return metrics low:
- Gross Margin: 68.62%
- Operating Margin: 29.19%
- Net Margin: 22.25%
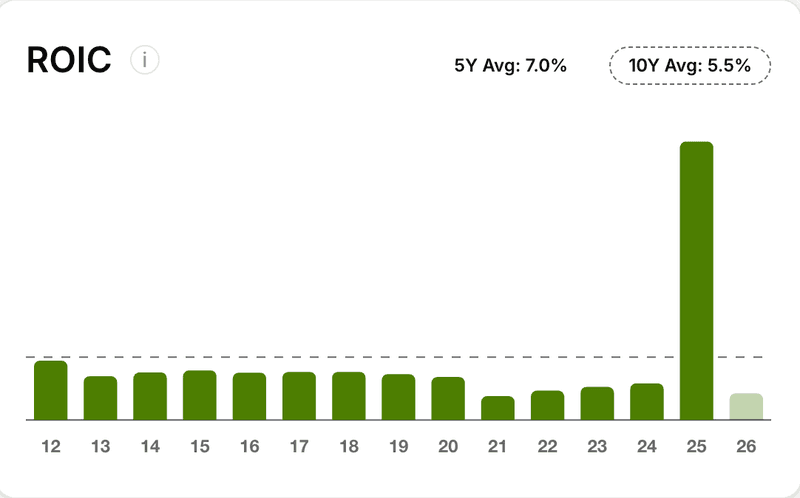
- ROIC (Return on Invested Capital): 2.28% (5-Yr Average: 7.0%)
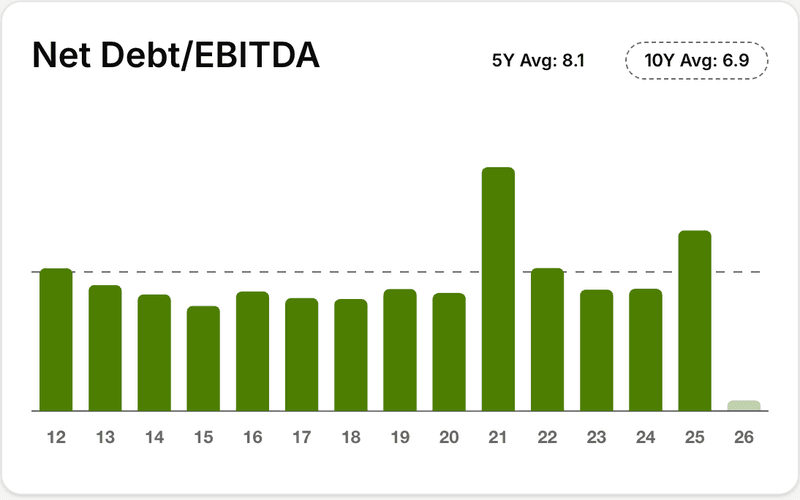
- Net Debt / EBITDA: 9.00 (5-Yr Average: 8.1)
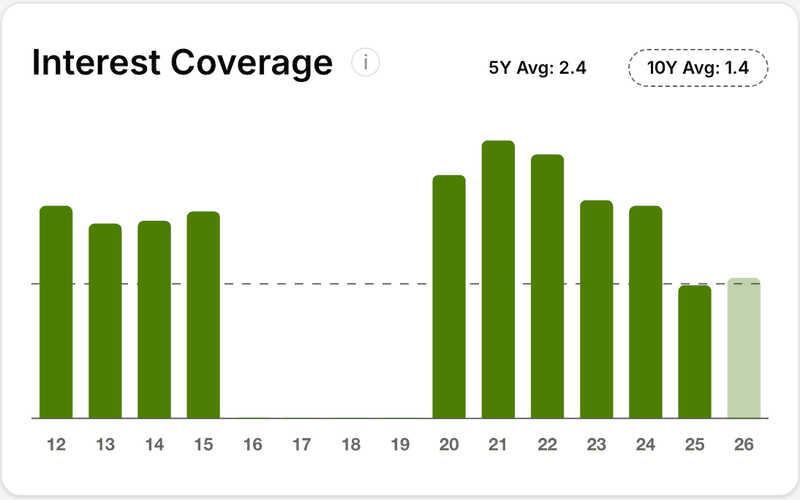
- Interest Coverage: 1.46 (5-Yr Average: 2.4)
Financial Growth & Revenue Analysis
A closer look at Realty Income’s Income Statement reveals rapid expansion in total revenue over the past decade, largely driven by strategic acquisitions and scale:
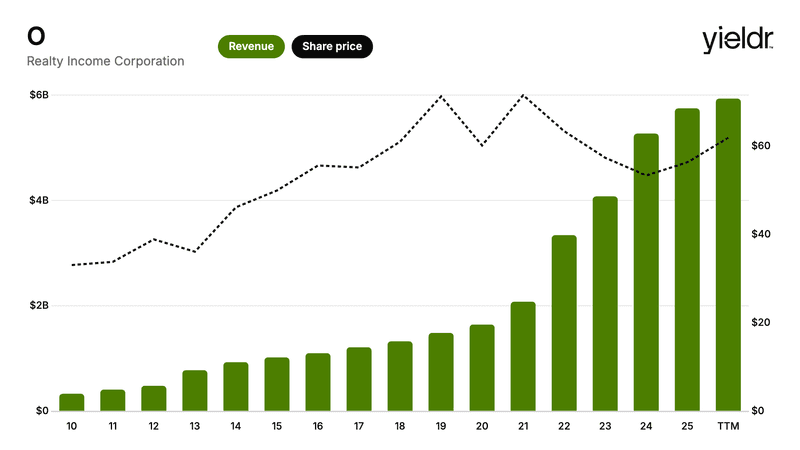
- TTM Revenue: $5.93B
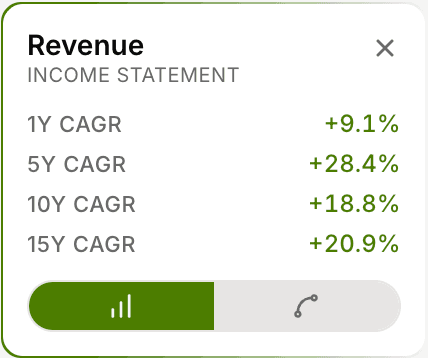
- 1-Year Revenue Growth: +9.1%
- 5-Year Revenue CAGR: +28.4%
- 10-Year Revenue CAGR: +18.8%
- 15-Year Revenue CAGR: +20.9%
Realty Income has grown its top line from under $500M in 2013 to nearly $6B TTM, proving its ability to successfully deploy capital and consolidate triple-net lease properties across North America and Europe.
Operating Metrics & Margins
-800x450.png&w=1920&q=75)
- TTM Gross Profit: $4.07B (Gross Margin: 68.6%)
- TTM Operating Income: $1.73B (Operating Margin: 29.2%)
- TTM EBITDA: $4.47B
- TTM Net Income: $1.32B
- Diluted EPS: $1.37

Capital Structure & Share Count Expansion
To fund its aggressive property acquisition strategy, Realty Income relies on a balance of debt and equity issuance:
-800x450.png&w=1920&q=75)
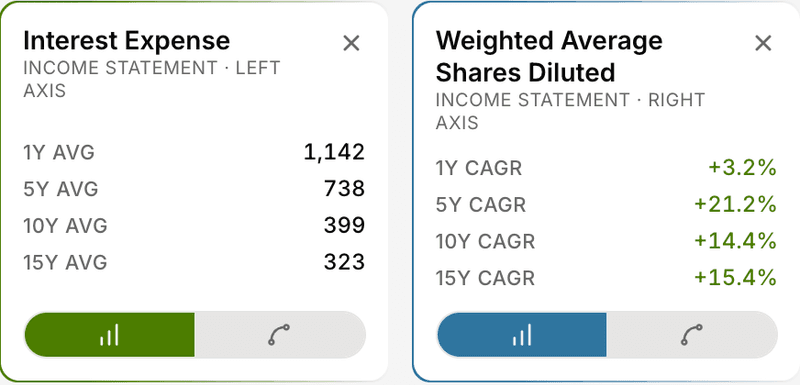
- Interest Expense (TTM): $1.18B (up from $1.14B in FY2025 and $1.02B in FY2024 as higher borrowing costs take effect).
- Weighted Average Diluted Shares: 935M TTM (up from 345M in 2020 and 133M in 2012).
Is Realty Income Stock a Buy Right Now?
For income-focused investors looking for steady cash flow, Realty Income’s 6.11% dividend yield, 32-year growth streak, and 8% discount to fair value make it a top-tier candidate in the REIT sector. While elevated interest expenses continue to weigh on net income, long-term investors are getting compensated with an above-average yield while waiting for interest rate tailwinds.
Analyze Any Dividend Stock in Seconds: Want to check the Quality Score, Fair Value Estimates, and 15-year financial trends for your portfolio holdings? Explore the The Best Dividend Tracker to streamline your dividend research.